Trade Audit 002 · Australia
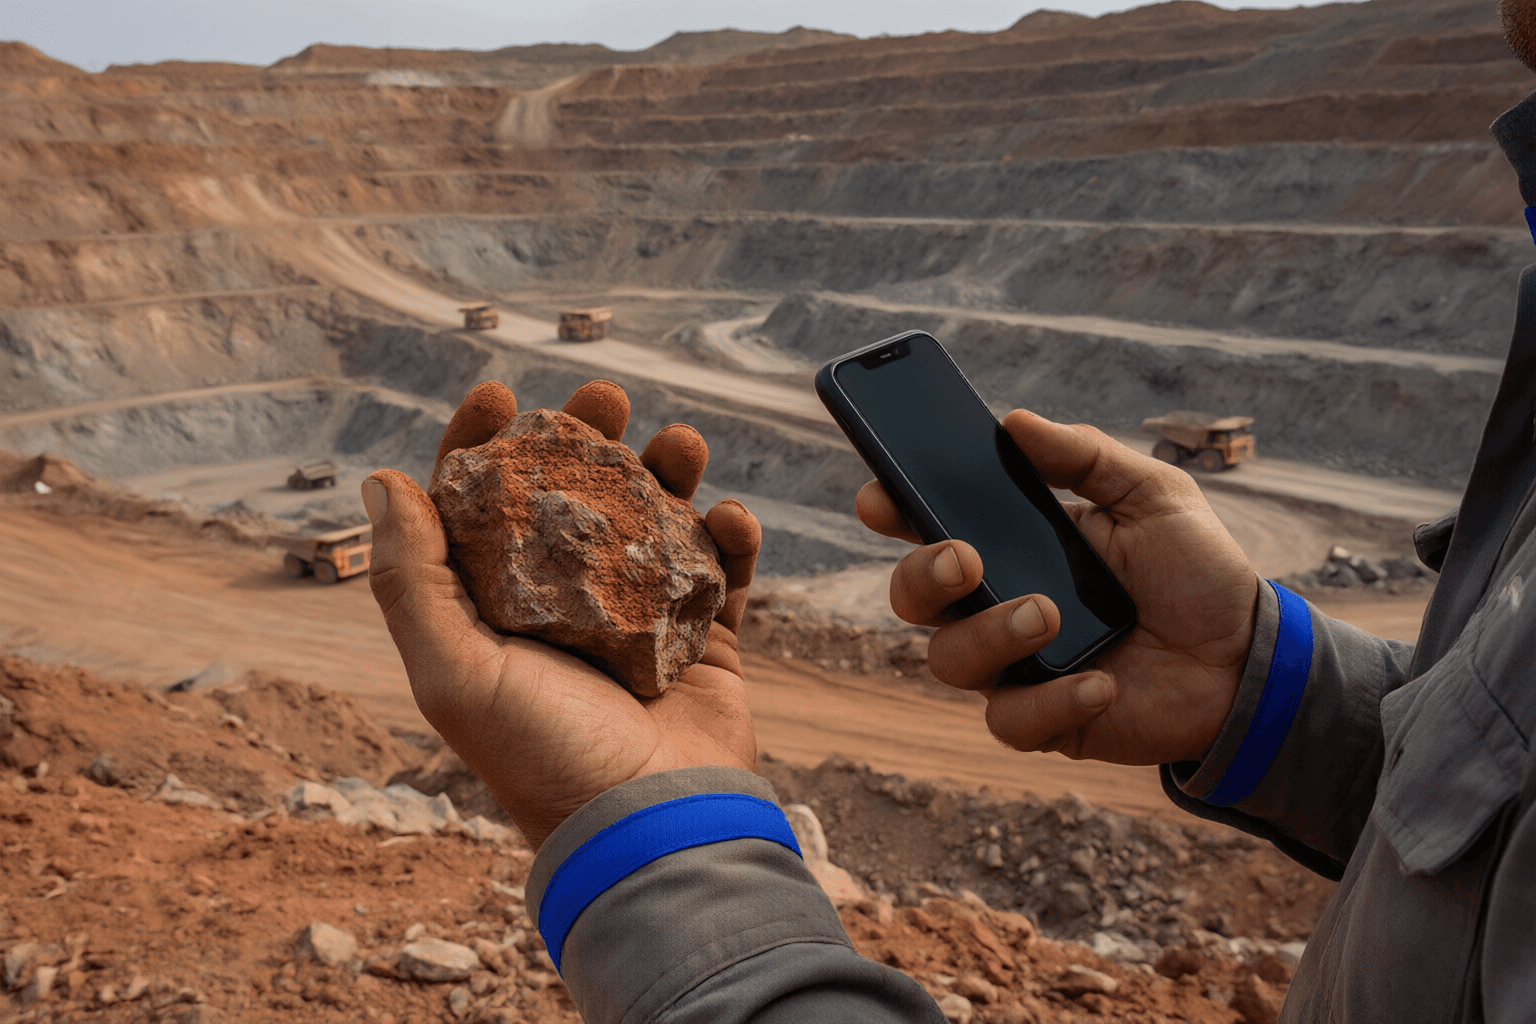
Australia sells rocks and gas to China, and buys cars and electronics from China. The trade structure has produced the fastest export growth of any advanced economy since 1990 — an 8.5× increase that generated a $30 billion surplus. The structure also means the Australian trade model works when China's property market is building and fails when it isn't. Lithium repeats the iron-ore pattern: 33.5% of global production, 98% exported as raw concentrate to China for processing. The value capture happens somewhere else.
Scorecard
| Market Share | Value Chain Depth | Profitability | Defendability | Frontier |
|---|---|---|---|---|
| 85 | 55 | 70 | 30 | 25 |
Headline Metrics (2025)
- Exports: $337.6 billion — up 8.5× from 1990 ($39.8B). 2022 peak: $412.7B.
- Trade surplus: ~$27 billion (2025), down from $98B (2022) as commodity prices eased.
- China dependence: 35% of exports to China. 25% of imports from China.
- Manufacturing share: 13.7% (1990) → 5.3% (2025) — among the lowest of any advanced economy.
- R&D/GDP: 2.40% (2008 peak) → 1.86% (2021) — below OECD average. Falling even as wealth rose.
- Lithium: World's #1 producer (33.5% global output). Only 11 kt LCE of chemical processing — 97% exported as raw spodumene.
The Two Booms
In 1990, Australia exported $39.8 billion — mostly wool, wheat, beef, and some coal. It imported $42.0 billion — mostly machinery and cars from Japan and the US. The trade structure was unremarkable. The economy ran small deficits that were easily funded.
China joined the WTO in December 2001. Australian exports doubled in five years — $63.4B (2001) to $123.4B (2006) — then doubled again to $271.7B (2011). Iron ore that sold for $38/ton in 2001 sold for $190/ton in 2011. Australia's terms of trade hit their highest level in 140 years. BHP and Rio Tinto became two of the world's largest mining companies. The mining investment boom was the largest capital expenditure cycle in Australian history — $450 billion+ invested in mines, rail, ports, and LNG facilities across the Pilbara and Queensland.
Then came the bust: iron ore crashed from $190 to $38/ton (2016), exports fell 31% from the 2011 peak, and the "mining cliff" devastated Western Australia and Queensland. Recovery was slow, with exports only returning to $271B by 2019.
The second boom dwarfed the first. Russia's invasion of Ukraine created a global energy and commodity crisis. LNG prices surged 5×. Coal hit $450/ton. Iron ore averaged $120/ton. Wheat hit $12/bu. Australia was the world's largest beneficiary: gas from the NW Shelf, coal from Queensland/NSW, iron ore from the Pilbara, wheat from WA/SA. Exports hit $412.7B in 2022 — 2.2× the pre-COVID level.
The Hollowing Out
While export value multiplied by eight, Australia's manufacturing sector shrank by 60%. Manufacturing as a share of GDP fell from 13.7% (1990) to 5.3% (2025) — a decline without parallel among advanced economies. Germany fell from 20% to 18%. The US fell from 16% to 10%. Australia fell from 14% to 5%.
The mechanism is the classic Dutch disease: commodity boom → appreciating currency → manufacturing becomes uncompetitive → factories close → workers shift to mining and services → economy specializes in what it's naturally good at. The economy prospers. The manufacturing base withers. Both things are true simultaneously.
The hollowing out is visible in innovation data. Australia's R&D expenditure peaked at 2.40% of GDP in 2008 — during the height of the mining boom — and has since declined to 1.86% (2021), well below the OECD average of 2.7%. Korea spends 4.8%. Germany spends 3.1%. Australia, with the strongest export growth in the developed world, spends less on R&D relative to GDP than it did in 2008. The resource boom did not fund an innovation boom. It funded consumption and real estate.
The Lithium Trap
Australia is the world's largest lithium producer, accounting for 33.5% of global output in 2025. The country mined an estimated 113,500 tonnes that year, rising toward 394,000 tonnes LCE as new mines ramped up. Australia also produces cobalt, nickel, graphite, and rare earths — the full critical-minerals portfolio.
And 97% of the lithium goes to China as raw spodumene concentrate. Australia produces roughly 11,000 tonnes LCE of lithium chemicals domestically — about 3% of what it mines. Benchmark Minerals estimates that Australia will mine 394,000 tonnes LCE of lithium but produce only 11,000 tonnes of chemicals.
The Kwinana refinery in Western Australia — a joint venture between Tianqi Lithium (China, 51%) and IGO (Australia, 49%) — is the country's first lithium hydroxide plant. It operated at 28% capacity in FY2025, producing 6,800 tonnes. A second refinery, the Mt Holland plant (Covalent joint venture), achieved first production in mid-2025 and aims to ramp to 50,000 tpa. But even at full capacity, Australia will process less than 15% of what it mines.
At IGO's AGM in November 2025, CEO Ian Vella said he "could not see a way to profitably refine lithium hydroxide in Western Australia." The structural obstacle is simple: China built the refining infrastructure first, built it at scale, and operates it at lower cost. Australia's competitive advantage is in digging, not processing. The market is efficient. The market also locks in the value-capture pattern.
China Dependence: The Single Chokepoint
| Metric | Australia | Brazil | Germany | USA |
|---|---|---|---|---|
| China share of exports | 35% | 28% | ~7% | ~7% |
| China share of imports | 25% | 24% | ~10% | ~21% |
| #1 export to China | Iron ore (~$95B) | Soybeans ($30.6B) | Autos (~$14B) | Soybeans |
| Dependence concentration | Single buyer, single commodity | Single buyer, 3 commodities | Diversified | Diversified |
| Substitutability risk | High | Mod-High | Low | Low |
China buys 60% of its iron ore from Australia. Australia's leverage is that no alternative supplier can replace that volume at comparable cost. But the leverage cuts both ways: if China's steel demand enters structural decline — 40% of Chinese steel goes into property, and China's property sector is contracting — the iron ore price falls and Australian exports go with it. Iron ore fell from ~$120/ton (2022) to ~$90/ton (2025). Australian exports fell from $412.7B to $337.6B over the same period.
The diversification play is India. Indian steel production is growing as it builds infrastructure. Australian iron ore exports to India are rising but from a low base. India currently absorbs about 6% of Australian exports ($20B), compared to China's 35% ($118B). The gap is enormous.
Structural Resilience: The Scorecard
Market Share: Australia accounts for roughly 1.4% of global goods exports — small, but the highest per-capita of the five commodity-exporting economies tracked. Export growth has been the fastest of any advanced economy since 1990. The problem: it's almost entirely price-driven, not volume-driven. When commodity prices fall, market share falls with them.
Value Chain Depth: The database lacks TiVA DVA data for Australia. But the export composition makes the pattern obvious: 58% mineral fuels and ores, 12% agriculture. Both are high-DVA sectors in principle — mined and grown domestically with modest foreign inputs. The value-chain question is not about DVA share but about whether Australia captures any value beyond extraction. On lithium, the answer is: barely.
Profitability: Australian commodities command no premium. Iron ore is priced on the spot market. LNG is benchmarked to JCC or TTF. Wheat is a global commodity. The only pricing power comes from being a large, reliable supplier — not from differentiation. When the cycle turns, margins compress immediately.
Defendability: The Australian trade model has one buyer and one product category that dominates. If Chinese steel demand enters structural decline, Australia has no Plan B that can compensate. India is growing but not fast enough. Critical minerals processing is a policy goal but not yet an economic reality. The $676 million federal fund for domestic mineral processing is a rounding error against the scale of Chinese investment.
Frontier: Australia exports almost no manufactured goods. It has negligible semiconductor, battery, or advanced manufacturing capacity. The innovation frontier is advanced mining technology — autonomous haul trucks, remote operations centers, AI-driven exploration — but these are productivity-enhancers for the existing model, not diversifiers away from it.
Summary
Australia's trade story since 1990 is the most successful commodity bet in the developed world. The China WTO accession produced the single greatest transfer of wealth to any advanced economy in the post-Cold War era. The 2022 energy crisis was a second windfall. The Lucky Country has been very lucky.
The bet is increasingly narrow. Australia's trade model depends on the continuation of Chinese demand for iron ore at high volumes and prices. Chinese property construction — 40% of steel demand — is in structural decline. Indian infrastructure spending is rising but from a much lower base. Lithium, the obvious diversification play, is repeating the iron ore pattern: raw materials exported, value captured in China, domestic processing constrained by cost competitiveness.
Trade Audit Verdict — Australia: The Australian trade model has been spectacularly successful. It has also hollowed out the manufacturing base that could provide diversification when the commodity cycle turns. The lithium story is a microcosm: Australia dominates global production but captures ~3% of the value-added from processing. A country that mines 33.5% of the world's lithium and processes 3% of it is not building a battery superpower. It is building a quarry. The quarry is very profitable when demand is high. The quarry has no pricing power when demand falls.
What to watch: (1) Chinese iron ore imports — any sustained decline below 1 billion tonnes/year signals structural demand shift. (2) Lithium hydroxide processing capacity — if Kwinana and Mt Holland reach 50%+ utilization, the value-capture story begins to change. (3) India's steel production trajectory — if India reaches 200 million tonnes by 2030, it becomes a meaningful alternative buyer. (4) Australian R&D/GDP — if it falls below 1.7%, the innovation base for any post-mining transition erodes further.